“The household, and not corporate, sector is responsible for the decline in investment rate between 2011-12 and 2016-17”
C. Rangarajan, Former Governor, Reserve Bank of India
Introduction: What does ‘Capital Formation’ Mean?
In order to comprehend what capital formation is and how it is relevant to the economy of a country, one should first understand what capital is, and what it does. Adam Smith famously defined capital as “that part of man’s stock which he expects to afford him revenue” . Undoubtedly, capital can be understood as a physical entity, or an asset, that provides, improves or enhances an individual’s or an organization’s ability to perform work that is economically relevant, and hence yields remuneration or revenue. It can be anything ranging from a sewing machine for a tailor, to an assembly robot for an automobile factory. ‘Capital stock’ is the amount of a capital employed by an individual or a firm at a given point of time.
Capital is different from other assets like land in one key aspect – the stock of capital can be increased, unlike that of land. Although economists assume the stock of capital to be fixed in the short run for ease of calculation, it changes in the long run. The total output of goods and services produced in a country is a function of labour and capital (land is always fixed, and organizational factors are not quantified), and is denoted as follows:
Y=f (L,K)
Capital and output share a positive relationship. This implies that an increase in the stock of capital of a firm can enable the firm to produce more. We can extrapolate this idea to the country as a whole, and conclude that increase in the capital stock of a country leads to an increased production of goods and services, and consequently, a higher national income. In simple terms, the country grows, as its capital stock expands. Economic growth (in terms of increase in GDP) of a country can occur in two important ways – either through an increase in the efficiency in utilization of existing capacity, or through new investment. In the long run, investment in new capital is the pivotal reason behind increased growth, as the utilization of existing resources will reach a saturation point.
Capital formation refers to the additions to the stock of capital possessed by a country or a firm, in a given period of time. In a less formal sense, the term ‘capital formation’ is used synonymous with ‘capital accumulation’, to indicate the total amount of physical capital generated in a country over a period of time. However, this essay strictly adheres to the definition of capital formation used in national income accounting. Lequiller and Blades (2014) state that in national accounts, physical investment, that is, the purchase of machinery, buildings and inventories, constitute Gross Capital Formation (GCF). When change in inventories is excluded, and only the purchase of machinery and buildings is considered, the result is Gross Fixed Capital Formation (GFCF). The Central Statistical Organization (CSO) publishes data regarding Gross Capital Formation by various institutional sectors on a yearly basis, and this serves as a tool to mathematically analyze the trend in capital formation.
The Relevance of Capital Formation in Indian Economy
Let us take a look at the performance of Indian economy before the 2008 global financial crisis. The following graph shows that Foreign Direct Investment (FDI) to India reached an unprecedented peak gradually between 2004 and 2008. During the same time, the GDP of our country grew at an annual rate of 9.3% (2005) to 9.8% (2007). During a brief period before the 2008 global financial recession, the high growth rate of the economy began to be taken for granted, and it was attributed to the capital inflows to the country from foreign sources.
Figure 1: Foreign Direct Investment in India – 1996 to 2019
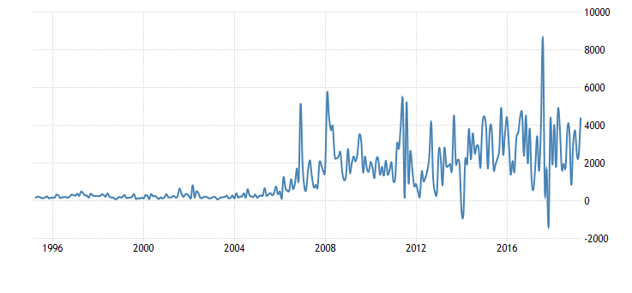
(Source: Reserve Bank of India, accessed via https://tradingeconomics.com/india/foreign-direct-investment )
However, the 2008 recession caused a visible decline in both of the variables under consideration – GDP and FDI. In fact, the impact of the recession on FDI can be observed in the uneven trend of FDI that persists even today. But, on a brighter side, India’s GDP growth rate has more or less recovered, and there were discussions everywhere on how our country did not go into the deep financial crisis that many other countries fell into.
The ‘plot twist’ of the story comes in here – the recovery was due to an increase in consumption and a consequential increase in aggregate demand (a purely domestic reason), rather than due to a revived level of foreign capital inflows, as a lot of experts anticipated. The bottom line of the analysis is that it is domestic capital formation that remained pivotal in helping the economy recover from the 2008 financial crisis, because of the simple reason that unlike foreign capital inflows, it is relatively less affected by global factors and is hence less volatile than the latter. This is the reason why a stable gross domestic capital formation is desirable for the country.
Trends in Capital Formation in India
The three important factors that contribute to capital formation are public investment, private investment and household investment. The key source of that funds these investments, is domestic saving.
A 1970 article from The Economic and Political Weekly by K.L. Deshpande, observes that gross domestic savings had evidently increased from 8.9 per cent of GDP in 1960-61 to 12.0 per cent in 1965-66. The article further proceeds to observe that “Net domestic capital formation in the household sector steadily increased in absolute terms. It is only investment in private corporate sector that sharply declined in a couple of years”.
However, interestingly, another article from the The Economic and Political Weekly, this time by Pulapre Balakrishnan in 1996, observes that post liberalization, aggregate domestic savings have declined steadily, from 23.7 per cent of GDP in 1990-91, to 20.2 per cent in 1993-94. He attributes it to a persistent, if not increasing consumption, even in the presence of income shocks that came as a consequence of the liberalization process. Now we observe data on the gross domestic savings from 2011-12 to 2015-16. Consider the following table (table 1).
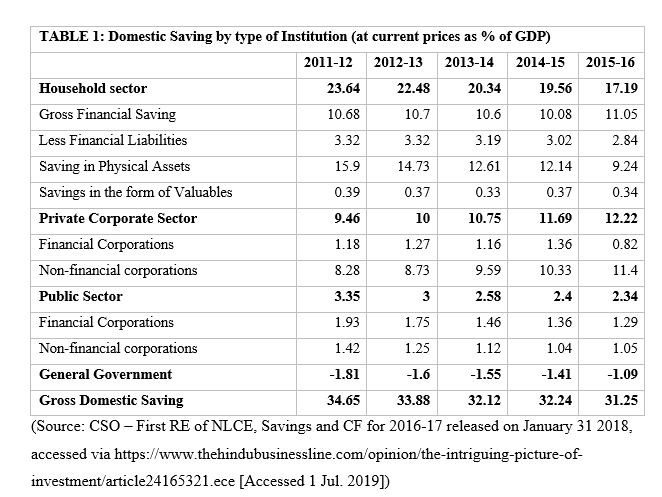
Table 1 can be represented graphically as follows (figure 2).
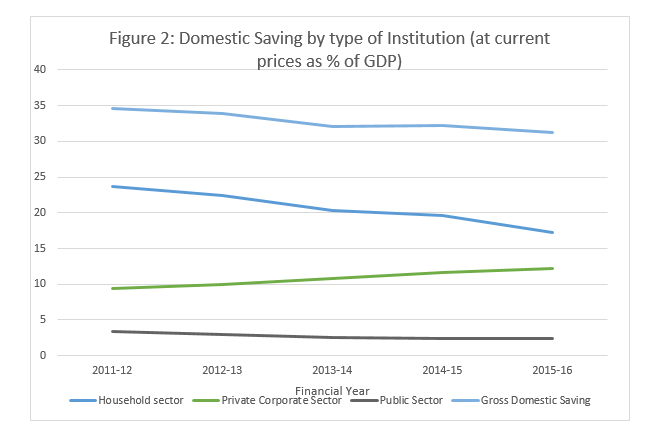
(Source: Author’s Calculations from Table 1)
The following observations can be made from the above graph –
- The gross domestic savings rate has decreased from 34.65 per cent of GDP in the financial year 2011-12 to 31.25 per cent in 2015-16.
- The household sector has seen the largest decline, where the total savings have fallen from 23.64 per cent of GDP in 2011-12 to 17.79 per cent in 2015-16.
- Interestingly, Private Corporate sector savings even saw a gradual rise, from 9.46 per cent in 2011-12 to 12.22 per cent in 2015-16.
- Public sector savings, (also ‘general government’), shows a gradual decline from 3.35 per cent in 2011-12 to 2.34 per cent in 2015-16.
Now, let us extend our analysis to capital formation itself. The following table shows gross capital formation in India between 2011-12 and 2015-16 (table 2).
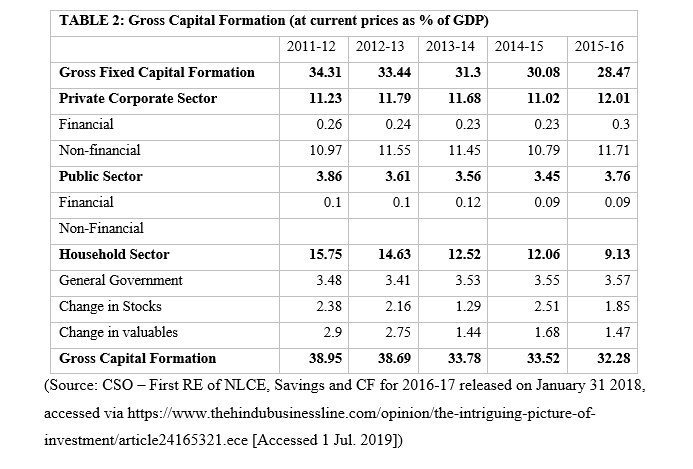
It has been represented graphically in figure 2.

(Source: Author’s Calculations from Table 2)
The following observations can be made from the above graph –
- The gross fixed capital formation rate fell from 34.31 per cent in 2011-12 to 28.47 in 2015-16.
- Public sector, including general government, underwent no significant change.
- Once again, investment in private corporate sector saw a rise, from 11.23 in 2011-12 to 12.01 in 2015-16.
- The most significant investment fall was experienced by the household sector – from 15.75 in 2011-12 to 9.13 in 2015-16.
The observations we have made so far can be summed up in this one statement, given by former governor of the Reserve Bank of India, C. Rangarajan, to ‘The Hindu’ in June 2018 – “The household, and not corporate, sector is responsible for the decline in investment rate between 2011-12 and 2016-17”.
Conclusions and Policy Suggestions
We have observed that it is investment in the household sector, and not that in private corporate or public sector, is responsible for the slowdown in capital formation in India. However, most of the current discussions, especially in political platforms, revolve around attracting foreign capital inflows. The volatility of foreign capital inflows often go ignored in such discussions.
The incumbent government has taken several measures (such as the December 2018 revision of FDI related rules of e-commerce, and the allowance of 100 per cent FDI in single brand retail through automatic route) to attract FDI to the country. Meanwhile, recent developments such as demonetisation have considerably weakened savings and capital formation in relation to household sector. The fact that the term ‘household sector’ incorporates non-corporate businesses as well, indicates that they have “suffered more and invested less” (Rangarajan, 2018).
Hence, it can be concluded that it is
high time that the nation comes up with solid policy measures to stimulate savings
and investment in the household sector. Some policy measures in this regard are
mobilizing savings by curbing black money and promoting the conversion of ‘dead
investments’ such as gold into financial assets. ‘Investment-incentivizing’
measures (improving the ease of doing business, creating a stable and
unambiguous tax environment) are the need of the hour. A Keynesian solution
would be increasing interest rates on deposits to reduce money demand and
thereby discourage increases in consumption. However, the applicability of such
a measure in the Indian Economy, requires further evaluation.
References
Balakrishnan, P. (1996). Savings Rate in Indian Economy since 1991. Economic and Political Weekly, Vol. 31, No. 35/37, Special Number (Sep., 1996), pp. 2527-2529+2531-2535. Stable URL: https://www.jstor.org/stable/4404570
Deshpande, K. (1970). Review: Estimates of Saving and Capital Formation. Economic and Political Weekly, Vol. 5, No. 20 (May 16, 1970), pp. 800-802. Stable URL: https://www.jstor.org/stable/4359985
Lequiller, F. and D. Blades. (2014). Understanding National Accounts: Second Edition. OECD Publishing, pp. 24-27. DOI: http://dx.doi.org/10.1787/9789264214637-en
Rangarajan, C. (2019). The intriguing picture of investment. [online] @businessline. Available at:https://www.thehindubusinessline.com/opinion/the-intriguing-picture-of-investment/article24165321.ece [Accessed 1 Jul. 2019].
Smith, A. (Author), Sutherland, K. (Editor). (2008). An Inquiry into the Nature and Causes of the Wealth of Nations: A Selected Edition (Bk 2, Chpt 01). Oxford Paperbacks, Oxford. ISBN 978-0199535927.

Amazing!! Great work.
LikeLiked by 1 person
amazing!
LikeLiked by 1 person
Great job! Very informative
LikeLiked by 1 person
Amazing content. Really informative. Thanks for sharing 👍🏼
LikeLiked by 1 person
Amazing work done
LikeLiked by 1 person
Well written…..keep it up
LikeLiked by 1 person
Really good Parvathy! Insightful
LikeLiked by 1 person
very well written!
LikeLiked by 1 person
Nice to meet macroeconomics😊👍
LikeLiked by 1 person
Good. Great work
LikeLiked by 1 person
Great. Good work
LikeLiked by 1 person
Great job, logically structured, informative and relevant…keeep going 👍👍
LikeLiked by 1 person
Very well stated, all facts and figures are very precise for easy understanding.
LikeLiked by 1 person
Very well written!
LikeLike
Great work parvathy..👍🏻
LikeLike
Great work!!
LikeLike
The research is truly amazing. Great work
LikeLike
Amazing research work.
LikeLike
Amazing research work!
LikeLike
Good work!
Good insights!
LikeLike
Extremely informative
LikeLike